![]()
CBDA Dumps with Practice Exam Questions Answers
CBDA by Business Data Analytics Actual Free Exam Practice Test
NEW QUESTION # 37
The results for a certification exam were revealed in percentage and percentile. The results for one of the attendees was: 75%, 90th percentile. What is the value in sharing the percentile score?
- A. While the exam score is an objective score, the percentile is a relative score that assesses the attendee's score against the highest possible score
- B. The percentile score provides value by assessing the attendee's score against the average score for that exam
- C. By ranking, it provided additional insight on how the attendee performed in comparison to other attendees
- D. The percentile score does not add any additional value in assessing the attendee's performance
Answer: C
Explanation:
Explanation
The percentile score provides value by ranking the attendee's score among all the scores of the exam takers. A percentile score of 90 means that the attendee scored higher than 90% of the exam takers, and only 10% scored higher than the attendee. This gives a relative measure of how the attendee performed in comparison to other attendees, and how competitive or exceptional the score is. The percentile score does not depend on the average or the highest possible score of the exam, but only on the distribution of the scores of the exam takers.
References:
*Business Analysis Certification in Data Analytics, CBDA | IIBA®, CBDA Competencies, Domain 4:
Interpret and Report Results
*Understanding the Guide to Business Data Analytics, page 9
*What is a Percentile? - Statistics By Jim
NEW QUESTION # 38
The results of the data analytics work led to some clear and strongly supported outcomes and the analytics team is very confident in their recommendations; particularly given that the payback on the required changes are a short 3 months. However, there is concern because the organization operates in a highly regulated environment and some new regulatory changes are being considered with announcements and implementation in the next 6 months. Under these conditions the team decides to:
- A. Postpone recommendations for 6 months until the announcements are made
- B. Recommend no action be taken at this time and revisit in 6 months
- C. Reassess their results to ensure their validity and then decide what to do
- D. Identify and carefully document assumptions for their recommendation
Answer: D
Explanation:
Explanation
The best option for the team under these conditions is to identify and carefully document the assumptions for their recommendation, such as the expected impact of the regulatory changes, the risks and benefits of implementing the changes before or after the announcements, and the sensitivity of the results to different scenarios. This way, the team can communicate their findings and recommendations clearly and transparently, while also acknowledging the uncertainty and limitations of their analysis. This can help the decision makers to evaluate the trade-offs and make informed choices12. References: 1: Guide to Business Data Analytics, IIBA, 2020, p. 242: Data-Driven Decision Making: A Primer for Beginners, Anand Rao, 2018, 1.
NEW QUESTION # 39
A consumer goods manufacturer has recently completed an analytics study to understand how to improve its operational excellence. From the top highlights, online sales outperformed other channels in sales growth and there was a direct relationship between positive customer reviews and increased internet sales. Which strategic business decision may be logically derived from these results?
- A. Encourage customers to complete online reviews
- B. Improve quality of the products
- C. Create an empowered and collaborative work culture
- D. Improve operational efficiencies
Answer: A
Explanation:
Explanation
The strategic business decision that may be logically derived from the results is to encourage customers to complete online reviews, because the results show that there is a direct relationship between positive customer reviews and increased internet sales. By increasing the number and quality of online reviews, the consumer goods manufacturer can boost its online sales performance, which outperformed other channels in sales growth. Online reviews can also help the manufacturer gain customer feedback, improve customer loyalty, and enhance its brand reputation. References:
*Business Analysis Certification in Data Analytics, CBDA | IIBA®, CBDA Competencies, Domain 5: Use Results to Influence Business Decision Making
*Understanding the Guide to Business Data Analytics, page 9
*CERTIFICATION IN BUSINESS DATA ANALYTICS HANDBOOK - IIBA®, page 8, CBDA Exam Sample Questions and Self-Assessment, Question 6
NEW QUESTION # 40
A real estate broker is tracking monthly sales between two of its teams. The results have been visualized. What insights can be drawn from the chart?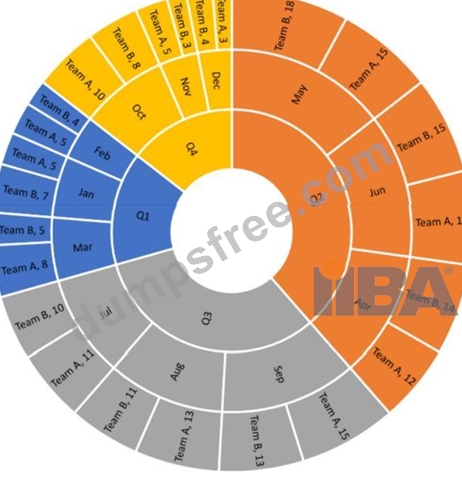
- A. Q2 was the strongest performing quarter with Team B having the top monthly sales in May
- B. Q4 was the lowest performing quarter with Team A having the lowest monthly sales in the Quarter
- C. Q4 was the lowest performing quarter with November having the lowest monthly sales in the year
- D. Q3 was the strongest performing quarter with Team A having the top monthly sales in the quarter
Answer: C
Explanation:
Explanation
The chart visualizes monthly sales data for two teams over a year, divided into quarters. By analyzing the data, it is evident that November (part of Q4) had the lowest monthly sales in the year, making option C correct.
There isn't enough information to verify the performance of individual teams in each quarter as per Business Data Analytics (IIBA®- CBDA) objectives and resources. References:
*[Business Analysis Certification in Data Analytics, CBDA | IIBA®], CBDA Competencies, Domain 4:
Interpret and Report Results
*[Understanding the Guide to Business Data Analytics], page 9
*[CERTIFICATION IN BUSINESS DATA ANALYTICS HANDBOOK - IIBA®], page 8, CBDA Exam Sample Questions and Self-Assessment, Question 7
NEW QUESTION # 41
The outcome from an analytics initiative has resulted in key stakeholders wanting to move forward with a project to redesign the company's website. The business analyst has called a meeting to work on drafting a plan to assess the level of effort required to complete this work. Many of the invited participants redesigned the website before and were invited so they could provide estimates using their knowledge and experience from the past. The business analyst is using which method to estimate this work?
- A. Rough order of magnitude
- B. Parametric
- C. Rolling wave
- D. PERT
Answer: A
Explanation:
Explanation
The business analyst is using the rough order of magnitude method to estimate this work. This method is based on expert opinion or experience from past projects, and it provides a quick and approximate estimate of the cost, time, or effort required for a project or a task. This method is useful when there is limited information or data available, or when a high-level estimate is needed for planning or budgeting purposes. However, this method also has a high degree of uncertainty and variability, and it should be refined as more details become available12 References: 1: Project Estimation Techniques Business Analysts Should Know About 2:
Estimation techniques for business analysts - The Functional BA
NEW QUESTION # 42
A business analyst manager is planning budgets for the new year, and training opportunities for his team of business analysts. The manager sends out a survey to the team to obtain their top interests within the seven areas of training opportunities. The team results were compared against the manager's personal rating. What can be deduced from the following chart with regards to the survey results?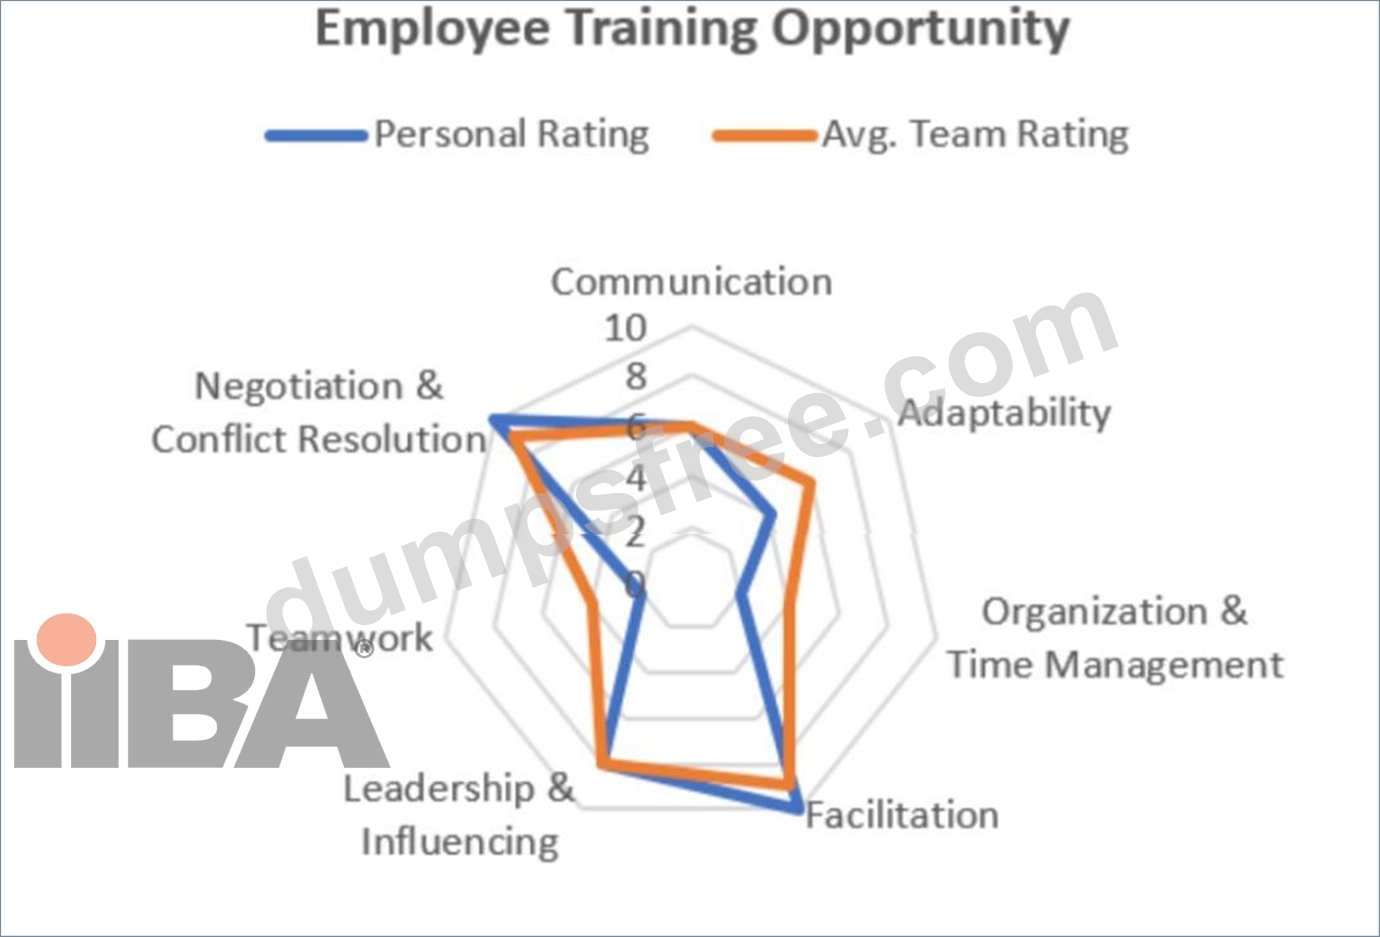
- A. The team's top interests in training opportunities were aligned with the manager's, which included Teamwork and Adaptability
- B. The team's top interests in training opportunities were aligned with the manager's, which included Negotiation & Conflict Resolution and Facilitation
- C. The team had equal interest across all training areas
- D. The manager's rating did not match with the team's rating for any of the training areas
Answer: B
Explanation:
Explanation
The chart shows the personal rating of the manager and the average team rating on different areas of training opportunities. Both the manager and the team rated "Negotiation & Conflict Resolution" and "Facilitation" highly, indicating a shared interest in these areas. These areas are also relevant for business analysts, as they involve skills such as communication, collaboration, problem-solving, and stakeholder management12 References: 1: 6 Charts You Can Use to Create Effective Reports | SurveyMonkey 2: Business Analysis Core Concept Model™ (BACCM™) - IIBA BABOK Guide v3
NEW QUESTION # 43
A professional association is funded by membership fees. The membership renewal occurs every 5 years.
Although, they have a strong subscription rate each year, their renewal rate is low. They are working with an external firm specializing in Business Analytics to identify the groups of customers that have a high likelihood of cancelling their subscription after their first 5-year term ends. This type of study is called:
- A. Untrained learning
- B. Supervised learning
- C. Unsupervised learning
- D. Trained learning
Answer: C
Explanation:
Explanation
Unsupervised learning is a type of study that involves finding patterns or clusters in data without any predefined labels or outcomes. It is useful for exploring data and discovering hidden structures or groups of customers. For example, the professional association can use unsupervised learning to identify the characteristics of customers who are likely to cancel their subscription after their first 5-year term ends, and then design strategies to retain them12 References: 1: What is Unsupervised Learning? - IBM 2: Unsupervised Learning - IIBA BABOK Guide v3
NEW QUESTION # 44
An analyst has just completed building a data model that shows the table structures including table names, table relationships with primary and foreign keys and column names with respective data types. What type of data model has the analyst just built?
- A. Hierarchical
- B. Physical
- C. Logical
- D. Conceptual
Answer: B
Explanation:
Explanation
A physical data model is the most detailed and specific type of data model, which shows how the data is stored, accessed, and manipulated in the database. It includes the table structures, column names, data types, primary and foreign keys, constraints, indexes, and other physical attributes of the data12. References: 1:
Guide to Business Data Analytics, IIBA, 2020, p. 542: Data Modeling Essentials, Graeme Simsion and Graham Witt, 2005, p. 15.
NEW QUESTION # 45
Interested in building out the analytics capability based on the positive results obtained by past analytics efforts, the Chief Marketing Officer (CMO) pitches the idea of using analytics to guide future decision making across the enterprise. Before allocating budget to build up an enterprise analytics practice, the decision makers should:
- A. Determine if the company has the sufficient resources to build up the analytics practice
- B. Identify the sponsor and a project manager who can collaborate on the development of the project charter
- C. Oversee the completion of up-front analysis to determine how value can be achieved through an enterprise-wide analytics practice
- D. Request that a small team be assembled to brainstorm a list of capabilities to develop with any approved monies
Answer: C
Explanation:
Explanation
Before investing in an enterprise analytics practice, the decision makers should have a clear understanding of the expected value and benefits of such a practice. This requires conducting an up-front analysis that identifies the business problems or opportunities that can be addressed by analytics, the data sources and technologies that are needed, the analytical models and methods that are appropriate, and the metrics and indicators that will measure the impact and outcomes of the analytics solutions12. This analysis will help to define the scope, objectives, and requirements of the enterprise analytics practice, as well as the resources, roles, and governance structures that are necessary to support it34. An up-front analysis will also help to prioritize the analytics initiatives based on their feasibility, alignment with the business strategy, and potential value creation
NEW QUESTION # 46
A colleague proposes measuring job satisfaction by asking the question "What is your salary?". What is the concerning factor about this question?
- A. Reproducibility
- B. Validity
- C. Clarity
- D. Subjectivity
Answer: B
Explanation:
Explanation
Validity is the extent to which a measure or a question accurately captures the intended concept or construct1.
The question "What is your salary?" is not a valid measure of job satisfaction, as it does not reflect the various aspects of job satisfaction, such as work environment, recognition, autonomy, growth, etc. Salary is only one possible factor that may influence job satisfaction, but it is not a direct or comprehensive indicator of it23.
Therefore, the question is not valid for measuring job satisfaction. References: 1: Guide to Business Data Analytics, IIBA, 2020, p. 302: Job Satisfaction: Application, Assessment, Causes, and Consequences, Paul E.
Spector, 1997, p. 23: Job Satisfaction Survey, 1.
NEW QUESTION # 47
While sourcing data, an analyst runs into a situation where different business units are using different names to refer to the same data element. This lack of standardization is resulting in confusion and additional time required to properly prepare data for analysis. Which practice, if implemented would address this situation and mature the organization's business analytics practice?
- A. Database operations management
- B. Data warehousing
- C. Data quality management
- D. Meta data management
Answer: D
Explanation:
Explanation
Meta data management is the practice that, if implemented, would address the situation and mature the organization's business analytics practice, because it is a technique that involves defining, documenting, and maintaining the information about the data elements, such as their names, definitions, formats, sources, and relationships. Meta data management can help the analyst resolve the inconsistencies and ambiguities in the data element names, and ensure that the data is standardized, consistent, and understandable across different business units. Meta data management can also help the analyst improve the data quality, accessibility, and usability for the analysis. References:
*Business Analysis Certification in Data Analytics, CBDA | IIBA®, CBDA Competencies, Domain 2: Source Data
*Guide to Business Data Analytics - Iiba - Google Books, page 14
*Business Data Analytics (IIBA®-CBDA Exam preparation) | Udemy, Section 2: Source Data, Lecture 8:
Meta Data Management
NEW QUESTION # 48
An online retailer has been successful utilizing analytics to guide decisions on product placement and marketing spend.
Management has requested a task force be assembled to make recommendations on how to further develop their analytics capabilities. To begin this work, the task force builds a model to develop a shared understanding about customer segments, customer relationships, key partnerships, and the company's value proposition. The team has leveraged the following model to facilitate this discussion?
- A. Balanced scorecard
- B. CATWOE
- C. Business model canvas
- D. Value chain analysis
Answer: C
Explanation:
Explanation
The business model canvas is the model that the task force has leveraged to facilitate the discussion, because it is a technique that describes the logic of how an organization creates, delivers, and captures value. The business model canvas consists of nine building blocks that cover the key aspects of a business: customer segments, value proposition, channels, customer relationships, revenue streams, key resources, key activities, key partnerships, and cost structure. The business model canvas can help the task force develop a shared understanding of the current state of the online retailer, and identify the opportunities and challenges for developing their analytics capabilities. References:
*Business Analysis Certification in Data Analytics, CBDA | IIBA®, CBDA Competencies, Domain 6: Guide Organization-level Strategy for Business Analytics
*Understanding the Guide to Business Data Analytics, page 9
*10.8 Business Model Canvas | IIBA®
NEW QUESTION # 49
A professor at a university has received a few complaints of the exams being too difficult. The professor is looking at exam performance results over the past 5 years to understand the normal tendency and outliers.
Which chart should the professor use?
- A. Pie chart
- B. Line
- C. Sunburst
- D. Scatterplot
Answer: D
Explanation:
Explanation
A scatterplot is a type of chart that shows the relationship between two variables by plotting data points on a two-dimensional plane. A scatterplot can help the professor to understand the normal tendency and outliers of exam performance results over the past 5 years by displaying the distribution, trend, and correlation of the data. For example, the professor can use the x-axis to represent the year and the y-axis to represent the exam score, and see how the scores vary over time and across different exams. Outliers can be identified as data points that are far away from the main cluster or the line of best fit12 References: 1: Scatter Plot - Statistics How To 2: Scatterplots - IIBA BABOK Guide v3
NEW QUESTION # 50
A company wants to gauge the thoughts of their employees towards a new company product. On the 25th of March the interviewer makes a list of all employees who were at work on that day and then chooses a subset of those employees to interview. Which term describes the list of all employees present on March 25th?
- A. Sampling frame
- B. Survey sample
- C. Sample weights
- D. Population of interest
Answer: A
Explanation:
Explanation
The sampling frame is the term that describes the list of all employees present on March 25th, because it is a technique that defines the set of elements from which a sample is drawn. The sampling frame should ideally match the population of interest, which is the group of elements that the researcher wants to study or make inferences about. In this case, the population of interest is the employees of the company, and the sampling frame is the subset of employees who were at work on a specific day. The survey sample is the technique that selects a portion of the sampling frame to participate in the survey. The sample weights are the technique that assigns different values or importance to each element in the sample, based on their representation in the population. References:
*Business Analysis Certification in Data Analytics, CBDA | IIBA®, CBDA Competencies, Domain 2: Source Data
*Understanding the Guide to Business Data Analytics, page 14
*CERTIFICATION IN BUSINESS DATA ANALYTICS HANDBOOK - IIBA®, page 8, CBDA Exam Sample Questions and Self-Assessment, Question 14
NEW QUESTION # 51
With the recent departure of two of its employees, an IT helpdesk team is now understaffed and finding it difficult to keep up with the current workload. The number of tickets being received has increased as well as the number of days to resolve the tickets. The IT manager has set up a meeting with the IT director to request funding for two new helpdesk agents. To prepare for the meeting, the manager is interested in showing the tickets processed against ticket volume over the past year.
What type of chart should the manager use to effectively show the change in processing rate over time?
- A. A waterfall chart to show the number of tickets coming in are a lot higher than those being processed as of year to date
- B. A pie chart to compare the number of tickets coming in versus tickets being processed each month, over the past year
- C. A column chart to compare the number of tickets coming in versus tickets being processed each month, since June
- D. A line chart to show the widening gap between the number of tickets being processed against the number coming over the past year
Answer: D
Explanation:
Explanation
A line chart is the type of chart that the manager should use to effectively show the change in processing rate over time, because it is a technique that displays data as a series of points connected by straight lines. A line chart can help the manager visualize the trends and patterns in the ticket volume and processing rate over the past year, and highlight the widening gap between them. A line chart can also show the seasonal variations and fluctuations in the data, and compare the performance of different categories or groups. Options A, B, and D are not suitable for showing the change in processing rate over time, because they are techniques that display data as proportions (A), comparisons (B), or accumulations (D) of different categories or groups at a single point in time or over a fixed period. References:
*Business Analysis Certification in Data Analytics, CBDA | IIBA®, CBDA Competencies, Domain 4:
Interpret and Report Results
*Understanding the Guide to Business Data Analytics, page 18
*16 Best Types of Charts and Graphs for Data Visualization [+ Guide]
NEW QUESTION # 52
Insights based on the data collected indicate that a multi-national company could increase its sales of a mature product by reducing its price by 20% which would result in increased revenues of 2% over a 6-month period.
The team recommends this as an appropriate goal for its organization. This is considered a good goal because:
- A. The organization can derive additional revenue from the product
- B. Management will be pleased that the mature product can still contribute to revenue
- C. It indicates that the company does not have to incur costs associated with retiring this product
- D. It meets all the criteria for a well-defined objective
Answer: D
Explanation:
Explanation
A well-defined objective is one that is specific, measurable, achievable, relevant, and time-bound (SMART)1.
The goal of increasing sales of a mature product by reducing its price by 20% which would result in increased revenues of 2% over a 6-month period meets all these criteria, as it clearly states what the desired outcome is, how it will be measured, whether it is realistic and attainable, how it aligns with the organization's strategy, and when it will be achieved2. References: 1: Guide to Business Data Analytics, IIBA, 2020, p. 192: SMART Goals: How to Make Your Goals Achievable, MindTools, 2021, 1.
NEW QUESTION # 53
There were 7 students enrolled in the Introduction to Artificial Intelligence course. These were the student's scores from the final exam: 64, 70, 80, 80, 90, 98, 100 What is the mean and mode for the outlined scores?
- A. 83.14, 80
- B. 80,80
- C. 80, 83.14
- D. 79.84, 81.40
Answer: A
Explanation:
Explanation
The mean is the average of all the scores, which is found by adding them up and dividing by the number of scores. The mode is the most frequent score, which is the one that occurs the most times. To find the mean and mode for the outlined scores, we can use the following steps:
*Arrange the scores in ascending order: 64, 70, 80, 80, 90, 98, 100
*Add up the scores: 64 + 70 + 80 + 80 + 90 + 98 + 100 = 582
*Divide the sum by the number of scores: 582 / 7 = 83.14
*The mean is 83.14
*Count how many times each score occurs: 64 occurs once, 70 occurs once, 80 occurs twice, 90 occurs once,
98 occurs once, 100 occurs once
*The score that occurs the most times is 80
*The mode is 80
Therefore, the mean and mode for the outlined scores are 83.14 and 80, respectively12 References: 1: Mean, median, and mode review (article) | Khan Academy 2: Mean, Median, and Mode: Measures of Central Tendency - Statistics By Jim
NEW QUESTION # 54
The analytics team is struggling with which recommendation to make. Their challenge is that they have five good options and this indecision is stopping them from moving forward. To help the team finalize their recommendation, the BA professional on the team recommends they complete:
- A. Acceptance and evaluation criteria
- B. Data flow diagrams
- C. Business rules analysis
- D. Root cause analysis
Answer: A
Explanation:
Explanation
Acceptance and evaluation criteria are the techniques that the BA professional on the team should recommend they complete, because they are the standards or measures that are used to evaluate the suitability and value of each option. Acceptance and evaluation criteria can help the team compare the benefits, costs, risks, and impacts of each option, and determine which one best meets the needs and expectations of the stakeholders.
Acceptance and evaluation criteria can also help the team communicate the rationale and evidence behind their recommendation, and ensure that the recommendation is aligned with the business goals and objectives.
References:
*Business Analysis Certification in Data Analytics, CBDA | IIBA®, CBDA Competencies, Domain 5: Use Results to Influence Business Decision Making
*Understanding the Guide to Business Data Analytics, page 9
*Acceptance and Evaluation Criteria | Business Analysis
NEW QUESTION # 55
An analyst is using a Data Flow Diagram (DFD) to depict the flow of data across a data security company.
Which of the following is true about DFDs?
- A. Are used to model data attributes
- B. Can illustrate a sequence of activities
- C. Provide similar information as process flows
- D. Can be categorized as Logical or Physical
Answer: D
Explanation:
Explanation
A Data Flow Diagram (DFD) is a technique that shows the flow of data among processes, data stores, and external entities in a system. DFDs can be categorized as logical or physical, depending on the level of detail and abstraction. A logical DFD focuses on the business functions and data flows, without specifying the implementation details. A physical DFD shows the actual components and mechanisms that are involved in the data flow, such as hardware, software, files, and network connections. References:
*10.13 Data Flow Diagrams | IIBA® - International Institute of Business ..., menu, 10.13 Data Flow Diagrams
*Business Analysis Certification in Data Analytics, CBDA | IIBA®, CBDA Competencies, Domain 2: Source Data
*Introduction to Business Data Analytics: Organizational View, page 16, Figure 6: Data Flow Diagram
NEW QUESTION # 56
......
Free Business Data Analytics CBDA Exam Question: https://www.dumpsfree.com/CBDA-valid-exam.html
CBDA dumps & Business Data Analytics sure practice dumps: https://drive.google.com/open?id=1O4WaOOPm50f8v06MgDJSavEB5v6DcNEe